
I always find working through a text book that it gets quite dry, and I struggle to maintain interest as the project or subject matter is too esoteric.
So, armed with a little python, StackOverflow and a search engine, I decided to see what I could do with my own data.

What have I been listening to for the last three or four years?
Google allows users access to all their past data, and as a long time user of Google Music I wondered what the oversight on all this would be. Unlike Spotify, there doesn’t seem to be any scope for introspection into musical history or taste, which strikes me as odd. I guess Google is more about harvesting and selling the data, whereas Spotify realises that showing insight into their users activity and taste helps drive traffic and engagement levels.
Google Takeout Track dataset structure

Seriously? A gazillion CSV files? Well… 14,646. That’s the best they can do? However, I then thought, hang on… combining multiple CSV files and cleaning up rubbish data in the dataset is the exact sort of basic data science 101 that every project has. Bring it on.
Track csv file combination
Python to combine the .csv files, lifted from my Jupyter Notebook
import os

# change as required, obviously
directory = '/takeout_data/Google Play Music/Tracks'

csv_files = []

for root,dirs,files in os.walk(directory):
    for file in files:
       if file.endswith(".csv"):
            csv_files.append(directory + "\\" + file)

print(len(csv_files))
Now lets iterate over the files found in the selected folder, add these to a list and then concatenate these into a pandas DataFrame. I’m painfully aware that the snippet below isn’t fully “pythonic” and wouldn’t win any stack overflow plaudits. However, I am backing myself to improve this at the end and I stated this would be a warts and all development blog. As such this is a “get this working to make sure I am going in the right direction and this is a good idea overall” mode. If its working I can move on and start to make enough progress to motivate myself to keep coding on the train and before bed each night. Also to be fair this code will be run on a once per archive result basis, so doesn’t need to be hugely optimised, considering the other project time dermands.
import pandas as pd

combined_csv = []
for i, csv_file in enumerate(csv_files):

    x = pd.read_csv(csv_file)

    if not pd.isna(x['Artist'].values) and x['Play Count'][0] > 0:
         if i % 100 == 0:
            print('100th Artist found: {}. Processing {}/{}'.format(x['Artist'].values, i, total))

        combined_csv.append(x)

combined_df = pd.concat(combined_csv)
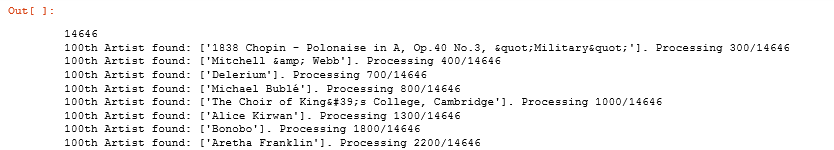
Which leads to the Jupyter Notebook output:
After saving this combined .csv file I thought I would have a quick peek into the data, to check what we were actually given.
Track combination sanity check
Ok, so now I know what I’ve listened to is all in one place. I now face some issues if I want to start answering the questions I had in mind.
- Is this data reliable, how much cleaning and transformation will be needed?
- When did these tracks get played?
- Where can I find the metadata for this basic track info?
I created a new Jupyter notebook in order to evaluate the data. As a cursory check I thought the tthe followong would be a good test
- See what the song length distribution was like
- Top Artists
- Total Number of Songs
- DataFrame.head() displays
Jupyter Notebook : TakeoutTrackAnalysisBlog
Further questions (for another blog post)
- What are my most popular artists, albums and genres?
- Do I have any dirty / unknown track data
- What are my top 10 shortest and longest tracks
